Aviation Hazards
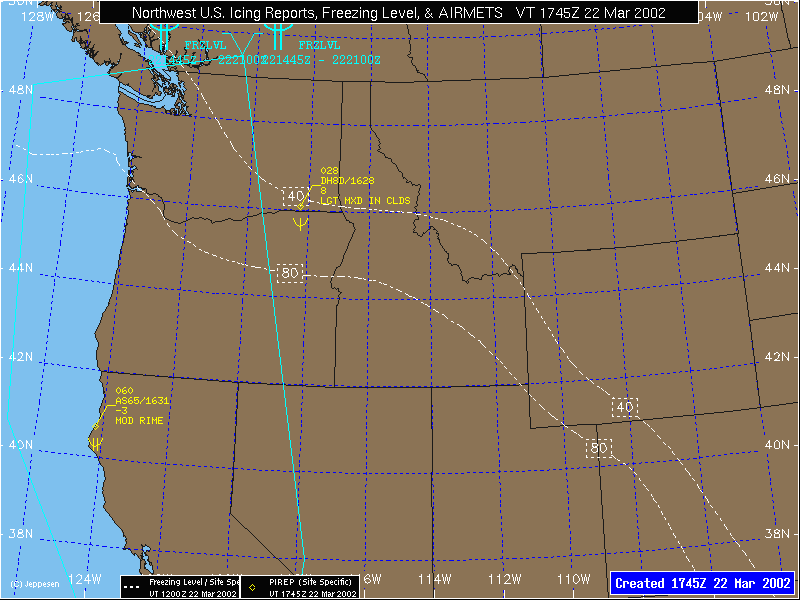
Icing Reports, Freezing Levels & AIRMETS
Features (U.S. Areas Only)
Icing Reports – Pilot Reports containing icing are depicted in yellow. Included from top to bottom are: Flight Level in hundreds of feet, aircraft type and time of report in UTC, outside air temperature in degrees Celsius, and the intensity and type of icing reported. An icing symbol also represents the intensity of icing. The diamond shape indicates the position of the aircraft when the report was issued.
Freezing Levels – White dashed lines indicated the freezing level contours as determined from the most recent Radiosonde and numerical model data. Contour intervals are labeled in hundreds of feet and drawn at 2000 foot intervals.
AIRMETS – Icing AIRMETS are graphically depicted as solid light blue lines. The intensity of the expected icing is depicted using icing symbols. The altitude range of the icing is labeled to the right of the icing symbol, with the upper altitude to the upper right, and the lower altitude to the lower right. Altitudes are labeled in hundreds of feet. FRZLVL is used to indicate that the actual freezing level is the lower altitude limit of icing. The start and expiration time of the AIRMET is depicted below the icing symbol, with the two digit day of month followed by the 4 digit hour and minute in UTC. Icing AIRMETS (named ZULU) are issued for areas expected to experience moderate icing conditions (outside convective activity).
Maps are updated every hour and are available between 30 and 45 past each hour.
Icing Forecast
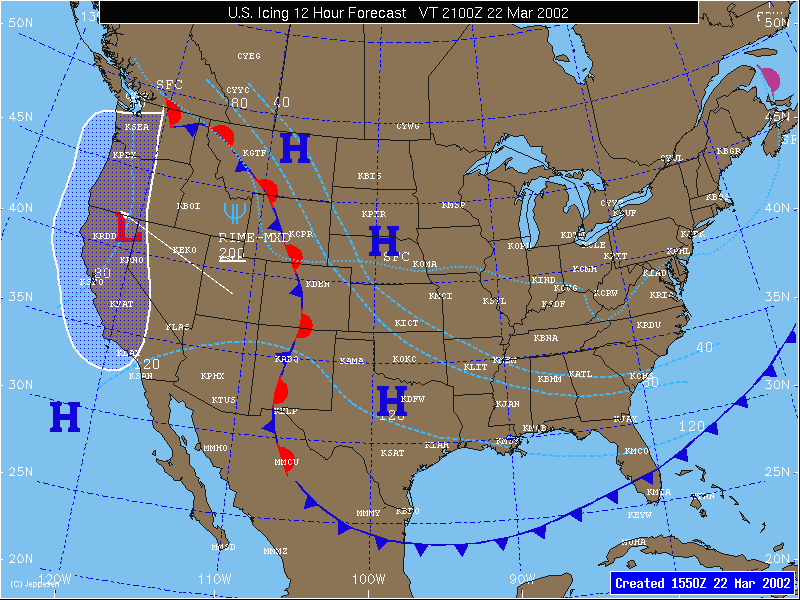
Features (U.S. Areas Only)
Surface Fronts – Cold fronts are dark blue, warm fronts are red, occluded fronts are purple, stationary fronts are alternating red/blue. Surface Troughs are dashed purple lines.
Icing Areas – Solid white lines with dark blue shading represent areas where icing is expected. The intensity is depicted using standard icing symbols. The type of icing expected is depicted directly underneath the intensity symbol. The altitude range of the icing is depicted underneath the icing type, with the upper limit above the lower limit with a horizontal bar between them. Altitudes are labeled in hundreds of feet.
Freezing Levels – Light blue dashed lines represent freezing level contours, drawn at 4000 foot intervals. Lines are labeled in hundreds of feet. A light blue dotted line represents the surface freezing contour when present.
Maps are updated 4 times per day and valid at 0400, 1000, 1600 and 2200 UTC. Maps are available approximated 4-6 hours prior to the valid time of the map.
Turbulence Reports and AIRMETS
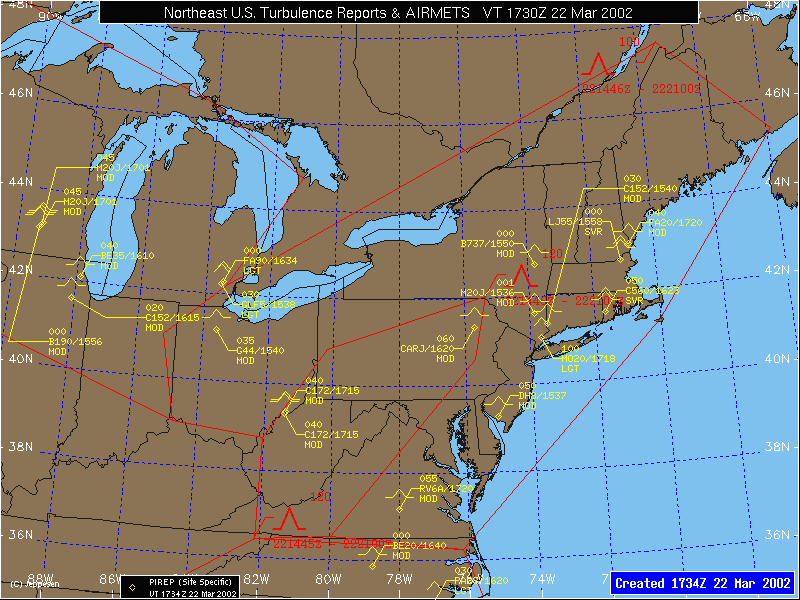
Features (U.S. Areas Only)
Turbulence Reports – Pilot Reports containing turbulence are depicted in yellow. Included from top to bottom are: Flight Level in hundreds of feet, aircraft type and time of report in UTC, and the intensity of turbulence reported. A turbulence symbol also represents the intensity of turbulence. The diamond shape indicates the position of the aircraft when the report was issued.
AIRMETS – Turbulence AIRMETS are graphically depicted as solid red lines. The intensity of the expected turbulence is depicted using turbulence symbols. The altitude range of the turbulence is labeled to the right of the turbulence symbol, with the upper altitude to the upper right, and the lower altitude to the lower right. If the lower altitude is not present, it is understood that the ground represents the lower limit. Altitudes are labeled in hundreds of feet. The start and expiration time of the AIRMET is depicted below the turbulence symbol, with the two digit day of month followed by the 4 digit hour and minute in UTC. Turbulence AIRMETS (named TANGO) are issued for areas expected to experience moderate turbulence (outside of convective activity).
Maps are updated every hour and are available between 30 and 45 past each hour.
IFR AIRMETS
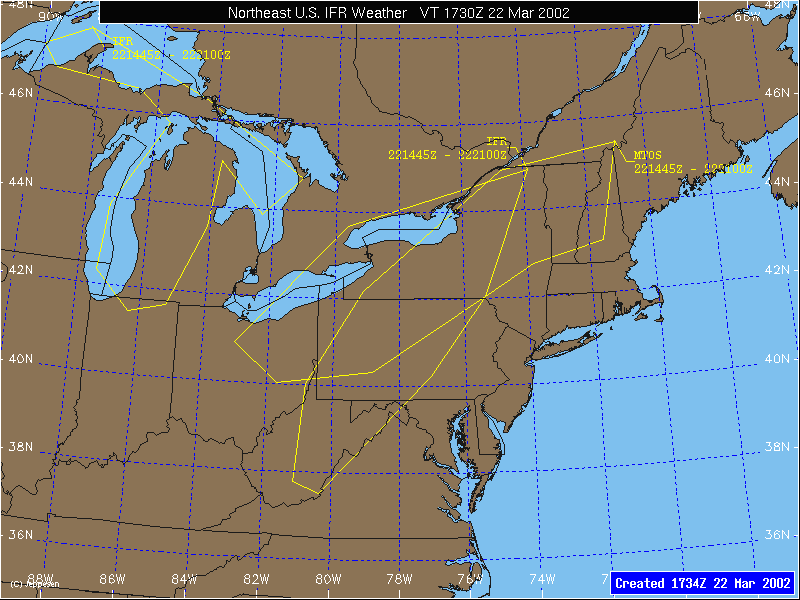
Features (U.S. Areas Only)
AIRMETS – IFR and Mountain Obscuration AIRMETS are graphically depicted as solid yellow lines. The type of AIRMET is labeled as either IFR or MTOS (Mountain Obscuration). The start and expiration time of the AIRMET is depicted below the AIRMET label, with the two digit day of month followed by the 4 digit hour and minute in UTC. IFR & Mountain Obscuration AIRMETS (named SIERRA) are issued for areas where IFR or mountain obscuration conditions are expected over 50% of the defined area.
Maps are updated every hour and are available between 30 and 45 past each hour.
SIGMETS and Convective SIGMETS
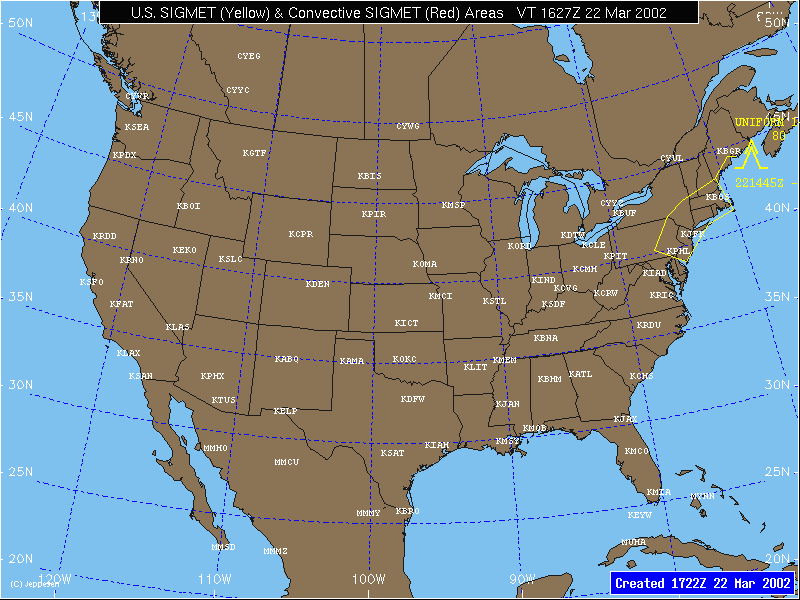
Features (U.S. Areas Only)
SIGMETS – All current SIGMETS are graphically depicted with solid YELLOW lines. The SIGMET name is depicted with a line pointing to the area. The start and expiration time of the SIGMET is depicted below the name, with the two digit day of month followed by the 4 digit hour and minute in UTC. SIGMETS are issued for severe or extreme non-convective turbulence or icing conditions.
Convective SIGMETS – All current Convective SIGMETS are graphically depicted with solid RED lines. The Convective SIGMET name is depicted with a line pointing to the area or line. The start and expiration time of the Convective SIGMET is depicted below the name, with the two digit day of month followed by the 4 digit hour and minute in UTC. Convective SIGMETS are issued for any of the following conditions: severe thunderstorms, embedded thunderstorms, lines of thunderstorms, areas that contain VIP level 4 echoes over 40% of an area at least 3,000 square miles.
Maps are updated every hour and contain the most recent information. Maps are available between 20 and 30 minutes past each hour.
Lifted Index
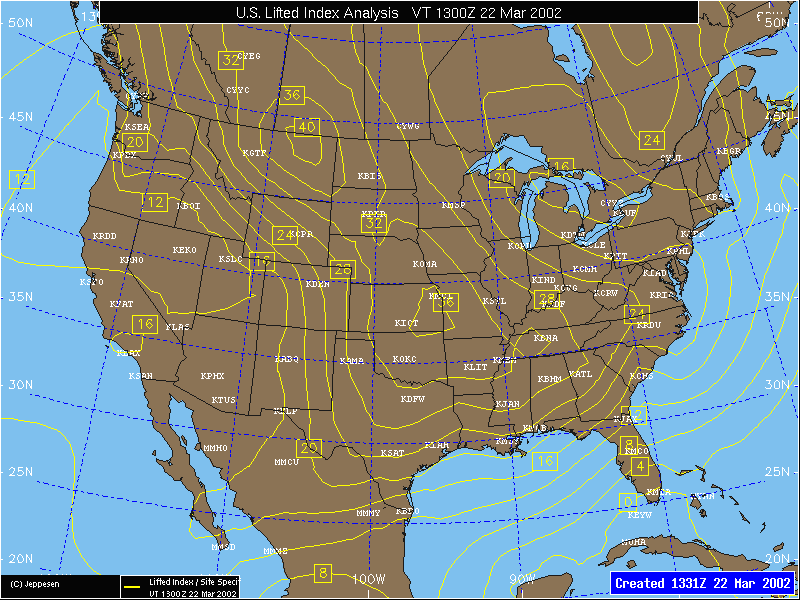
Features (U.S. Areas Only)
Lifted Index – Map displays contours of the Lifted Index, at 4 unit intervals. The Lifted Index (LI) is a measure of the stability of the atmosphere. It is simply the difference between the observed 500 mb temperature and the temperature that a parcel of air would have if it were lifted from the boundary layer to the 500 mb level. If the LI is positive, the atmosphere is stable. If the LI is negative, the atmosphere is unstable. In terms of thunderstorms, the chance for thunderstorms increases as the LI decreases. For practical purposes, this is a general relationship between LI and thunderstorm development:
LI Value Thunderstorm Probability
> 4 None
1 to 4 Slight Chance of Thunderstorms
-2 to 0 Thunderstorms Possible, slight risk of Severe Thunderstorms
-3 to –5 Thunderstorms Likely, moderate risk of Severe Thunderstorms
< -5 Strong risk of Severe Thunderstorms
Maps are updated 4 times per day and are valid at 0000, 0600, 1200 and 1800 UTC. Maps are available 1 ½ hours past the valid time. Maps are created for the analysis, 12 and 24 hour forecast period each time they are generated. The LI maps are computed from radiosonde and numerical model data.
Hurricane/Typhoon Tracks
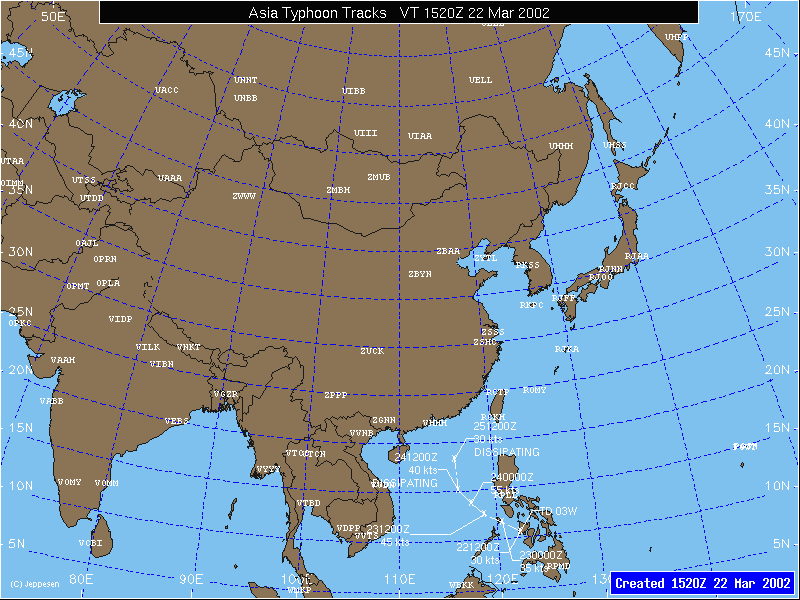
Features
Hurricane/Typhoon Track – Map graphically depicts the current and forecast positions of all active tropical systems. Storms are color coded for easy recognition:
Tropical Depression (White) – Wind speed less than 35 knots.
Tropical Storm (Yellow) – Wind speed between 35 knots and 64 knots.
Hurricane/Typhoon/Tropical Cyclone (Red) – Wind speed greater then or equal to 65 knots.
Depicted for each system is the name of the storm at the current position. Also depicted is the day of the month and time of the current position or forecast, underneath the day and time is the central pressure of the storm in mb, and below that is the wind speed in knots. Each track contains the current position and then 12, 24, 36, 48 and 72 hour forecast positions and data.
Maps are updated 4 times per day (0000, 0600, 1200 and 1800 for international areas, 0400, 1000, 1600 and 2200 for Atlantic, Caribbean and Eastern Pacific storms handled by the U.S. National Hurricane Center. Maps are available approximate 30 minutes past the update times.